
A useful Instagram benchmark is not a single percentage. It is a defined comparison: the same denominator, interaction definition, account population, format and time period.
That matters because a follower-based rate used to compare public competitors answers a different question from a reach-based rate in your own Insights. A global organic-post study is also not a UK brand benchmark, even when its format findings are useful context.
The rule worth memorising is simple: memorise the method, not a magic number.
Choose the denominator before judging the result
Choose the denominator according to the reporting question; do not treat the resulting rates as interchangeable.
Follower-based engagement rate is the most practical convention for public peer analysis because follower counts and visible post interactions can be observed consistently. Rival IQ defines its benchmark engagement rate as measurable interactions divided by follower count, multiplied by 100.
For owned-account reporting, teams may additionally calculate interactions as a proportion of reach, or, for video, views. These are reporting conventions rather than a single universal platform standard: document the exported Insights fields and the exact formula used in your dashboard.
| Reporting purpose | Formula | Appropriate use | Limitation |
|—|—|—|—|
| Public peer comparison | selected interactions ÷ followers × 100 | Comparing matched public brand accounts | Followers are not the people who necessarily saw the post |
| Owned-account distribution analysis | selected interactions ÷ reach × 100 | Understanding response among accounts reached | Requires first-party reach data |
| Video or Reel response analysis | selected interactions ÷ views × 100 | Assessing response relative to recorded views | Views are not necessarily unique accounts |
Different denominators create different rates from the same post. For a fuller explanation of the calculation choices, see the benchmark guide.
Worked example: one fictional post, three answers
Assume a fictional brand has 20,000 followers. A post reaches 5,000 accounts, records 8,000 views and receives 240 selected interactions.
| Calculation | Rate | Interpretation |
|—|—:|—|
| 240 ÷ 20,000 × 100 | 1.2% | Response relative to the follower base |
| 240 ÷ 5,000 × 100 | 4.8% | Response among accounts reached |
| 240 ÷ 8,000 × 100 | 3.0% | Response relative to recorded views |
All three calculations are valid if labelled correctly. The reporting error is presenting them as interchangeable.
[Visual placeholder: `instagram-engagement-rate-method-flowchart.png` — Flowchart for selecting follower-, reach- or view-based reporting. Alt: “Instagram engagement-rate denominator selection flowchart.”]
Define the numerator as carefully as the denominator
“Engagement” can mean likes and comments only, or a broader group including saves and shares. In owned reporting, teams may also separately monitor replies, profile actions and direct messages. These should not be silently combined with post interactions unless the reporting definition says they are included.
Write a fixed definition for the quarter. For example: “Organic feed-post engagement comprises likes, comments, saves and shares; the rate is calculated against reach.” Keep that definition unchanged while comparing months, formats and peers.
Public competitor analysis is more limited. Public posts may show likes and comments, but competitors’ first-party Insights data for reach, saves, shares, replies, direct messages and Story outcomes is not available as a complete public dataset. Some visible counts or actions may appear in limited contexts, but they are not a reliable substitute for owned-account reporting. Treat public analysis as directional and use your own Insights export for operational decisions.
What the available UK evidence can—and cannot—say
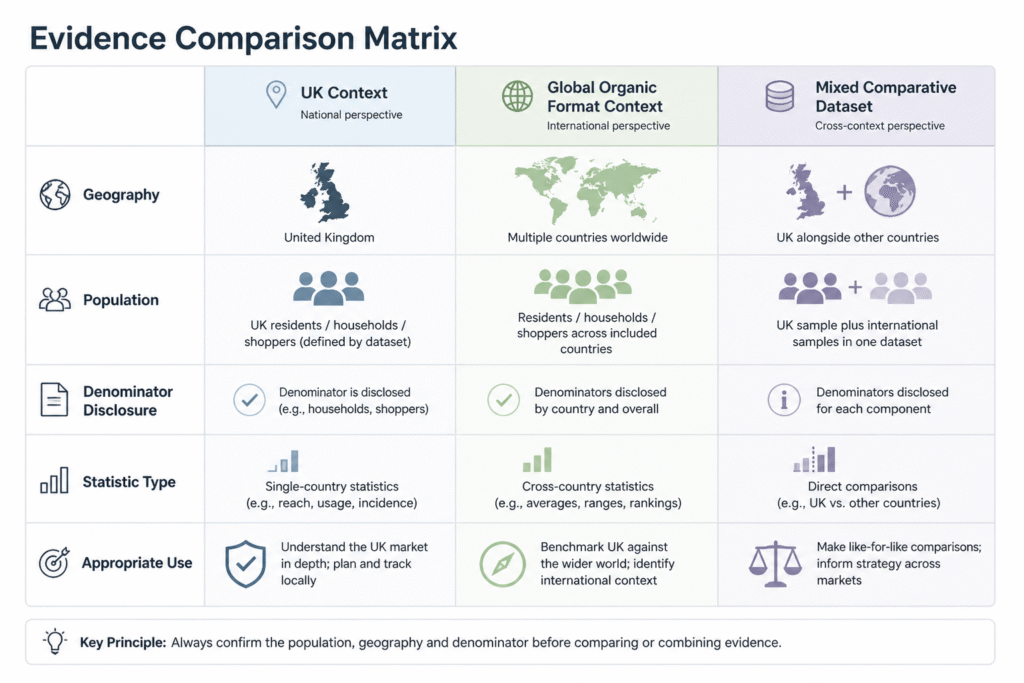
Benchmark figures should be compared only after checking population, period, denominator and statistical treatment.
Dash Social’s UK page, updated 19 March 2026, reports a 1.6% average Instagram engagement rate for 1 July–31 December 2025. It also describes an analysis of “nearly 175 UK Instagram and TikTok accounts”, with accounts required to have at least 1,000 followers and brands spanning beauty, fashion, luxury, media and publishing, CPG, food and beverage, retail, home, baby and children, and wellness.
This is useful UK context, but it should not be presented as a definitive UK Instagram benchmark. The published description does not disclose the number of Instagram accounts within the mixed Instagram-and-TikTok account population, nor does the supplied report detail the Instagram denominator, interaction definition or whether 1.6% is a mean or median. Those gaps prevent a like-for-like comparison with another vendor’s figure or a sector target.
| Source and publication date | Geography and measurement period | Population and account type | Reported result | Methodology disclosure and use |
|—|—|—|—:|—|
| Dash Social, *UK Social Media Benchmarks*, published 8 November 2024; updated 19 March 2026 | UK; 1 July–31 December 2025 | Nearly 175 UK Instagram and TikTok accounts; minimum 1,000 followers; named brand categories | 1.6% average Instagram engagement rate | Instagram account count, denominator, interaction definition and mean/median status are not disclosed in the supplied page evidence. Use as dated UK context, not a universal target. |
Table methodology note: The Dash Social page also reports averages of 1,518,244 followers, eight weekly posts, 58,997 reach per post, 177,454 views per post, 413 shares per post and 179 saves per post for the stated UK sample and period. These are descriptive sample averages, not account-size or industry benchmarks.
Avoid labels such as “healthy” or “exceptional” for UK brands unless a source supplies a matched UK population, period, denominator and statistic. No verified UK-specific account-size or industry bands are available in the evidence reviewed here.
Format benchmarks are comparative, not instructions
Socialinsider’s 2026 Instagram organic benchmark page reports global engagement rates of 0.52% for Reels, 0.55% for carousels and 0.37% for images. Its separate 2026 engagement report says it analysed 15 million Instagram posts and found carousels led overall engagement and saves, while Reels generated more comments and shares.
Rival IQ’s 2025 Social Media Industry Benchmark Report, published 25 February 2025, reports that carousels led Instagram engagement in its comparative dataset. The report covers more than four million posts and nine billion likes, comments and shares across Facebook, Instagram, TikTok and Twitter, spanning 14 industries. It uses median performance from selected companies and includes a mixture of organic and paid posts.
Neither source is UK-representative on the evidence available. Their findings describe their datasets; they do not establish that Instagram favours a format or that a format will outperform for every UK brand.
| Source and publication date | Geography, period and population | Format results | Denominator, interactions and statistic | Interpretation |
|—|—|—|—|—|
| Socialinsider, *2026 Instagram Organic Engagement Benchmarks*, 2026 | Global organic Instagram dataset; measurement period and sample size not disclosed in the supplied page evidence | Reels 0.52%; carousels 0.55%; images 0.37% | Denominator, interaction definition and mean/median status require checking in the live methodology before reuse | Global format context only, not a UK target |
| Rival IQ, *2025 Social Media Industry Benchmark Report*, 25 February 2025 | Comparative multi-platform dataset; more than four million posts; 14 industries; exact measurement period should be checked in the report before reuse | Carousels led Instagram engagement in the dataset | Median performance; measurable interactions divided by followers; organic and paid posts mixed | Useful for method and relative comparison, not a clean organic UK brand benchmark |
Table methodology note: Do not rank the Dash Social, Socialinsider and Rival IQ percentages against one another. Their disclosed geography, platform mix, organic/paid composition, denominator and statistical treatment differ or are incomplete.
Stories should sit outside public format benchmarking. Use owned-account measures—such as reach, exits, replies or link activity where available in your reporting setup—and compare them against your own historical results.
[Visual placeholder: `instagram-format-benchmark-evidence-matrix.png` — Matrix distinguishing UK context, global organic format findings and mixed-distribution comparative data. Alt: “Methodology differences between Instagram format benchmark datasets.”]
Account size and industry: match peers rather than assume a curve
It is tempting to apply a universal rule about follower count or sector. Do not. The available evidence does not support verified UK engagement-rate bands by account size or industry, and a brand account, publisher, creator and influencer account may have fundamentally different audience relationships and objectives.
Instead, create a peer set of eight to 15 accounts that broadly match:
- audience geography and commercial market;
- sector and content role;
- follower scale and posting cadence;
- brand-led versus creator-led account type; and
- organic versus paid distribution.
Use the same follower-based formula across public peers. For your own account, add reach-based analysis separately rather than placing it in the same league table.
Prefer medians when individual posts are uneven
A mean is the total of all results divided by the number of posts. A median is the middle result after posts are ordered from lowest to highest. If one campaign post performs unusually strongly, the mean can move substantially while the median may better reflect a typical post.
Rival IQ’s use of median performance is a useful reminder to show more than one summary figure. For each format and quarter, report:
- median engagement rate;
- mean engagement rate;
- post count; and
- range, with a note for campaign or unusual posts.
A conclusion from three posts should carry less confidence than one based on a planned quarter of output. This is not a claim that medians are always superior; it is a practical safeguard against allowing a small number of outliers to define the story.
A quarterly framework for UK brand reporting
A consistent scorecard keeps methodology, performance and uncertainty visible in the same report.
- Separate the content populations. Keep organic brand posts, boosted posts, paid campaigns and influencer content apart.
- Set the formula. State the numerator, denominator and included interactions in the report header.
- Record the mix. Note the number of Reels, carousels, images and Stories, plus campaign activity and posting frequency.
- Create a rolling baseline. Compare the current quarter with prior quarters measured using the same rule.
- Add matched peers. Use public follower-based rates only when accounts and date windows are comparable.
- Review quarterly. Explain seasonality, paid support, creative changes and small sample sizes before attributing a trend to content quality.
| Reporting field | What to show |
|—|—|
| Benchmark | Internal rolling median and matched-peer reference, with methodology |
| Actual | Median, mean, range and post count by format |
| Variance | Difference from the selected baseline |
| Likely explanation | Distribution, content mix, campaign activity or audience relevance |
| Quality signals | Saves, shares, meaningful comments, replies and DMs where included and available |
| Business outcome | Reach, traffic, leads, sales or another agreed measure |
| Confidence note | Missing data, small samples, outliers or methodology changes |
[Visual placeholder: `quarterly-instagram-stakeholder-reporting-template.png` — Blank scorecard showing benchmark, actual, variance, explanation, action and confidence note. Alt: “Quarterly Instagram stakeholder reporting template.”]
Engagement quality belongs beside engagement rate
A rate alone does not prove commercial success. A lightly distributed post can produce a high rate but limited total reach; another may earn a lower rate while reaching a much larger relevant audience. Likewise, likes are not interchangeable with saves, shares, substantive comments or direct-message conversations.
Report total engagement alongside quality signals and agreed business measures. Socialinsider’s 2026 global analysis is a useful example of why: it separates overall engagement from comments, shares and saves by format. Your own reporting should make the same distinction where first-party data is available.
The practical conclusion
There is no universal Instagram engagement rate to memorise for a UK brand. Use dated external studies as context, but only after checking their population, geography, period, denominator, interaction definition and mean-or-median treatment.
The operating benchmark should be a consistent internal baseline plus a carefully matched peer set. Update it when the audience, content mix, paid distribution or reporting method changes.
For a complementary explanation of measurement choices, Brecktic maintains an editorial reference on Instagram engagement-rate methodology.