As cloud-native applications continue to evolve, organizations are generating more telemetry data than ever before. Modern infrastructures now span Kubernetes clusters, containers, microservices, serverless workloads, and multiple cloud providers, making system visibility increasingly complex. Choosing the right observability tools is no longer just an operational decision—it’s a strategic investment that directly impacts application reliability, troubleshooting speed, and infrastructure costs.
While countless observability platforms are available today, not every solution is designed for large-scale environments. Some focus solely on metrics, while others specialize in logs or distributed tracing. The most effective observability tools provide a unified platform capable of collecting, storing, and analyzing metrics, logs, and traces together.
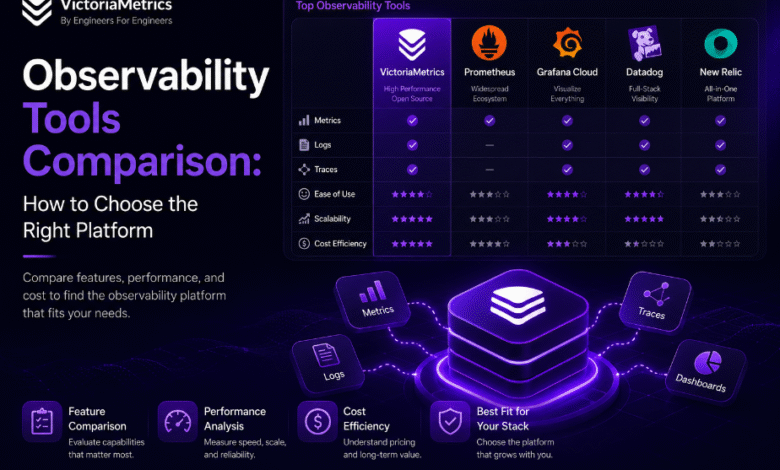
In this guide, we’ll explore what observability tools are, the key features to look for, and why selecting a scalable platform like VictoriaMetrics can help future-proof your monitoring strategy.
What Are Observability Tools?
Observability tools are software platforms that help engineering teams monitor, analyze, and troubleshoot modern applications and infrastructure. Unlike traditional monitoring solutions that rely on predefined alerts and dashboards, observability platforms allow teams to investigate unexpected issues by correlating telemetry data across an entire system.
A complete observability platform typically collects:
- Infrastructure metrics
- Application metrics
- Logs
- Distributed traces
- Events
- Alerts
By combining these data sources, engineers can quickly identify the root cause of performance issues instead of investigating isolated alerts from multiple monitoring systems.
Why Traditional Monitoring Is No Longer Enough
Traditional monitoring worked well when applications ran on a handful of physical servers. Today, cloud-native environments are far more dynamic.
Applications frequently include:
- Kubernetes clusters
- Containers
- Microservices
- APIs
- Managed cloud services
- Serverless functions
A single user request may pass through dozens of services before reaching a database. If latency increases anywhere in that chain, traditional monitoring may indicate a problem without identifying its source.
Modern observability tools solve this challenge by connecting metrics, logs, and traces into a single operational view, dramatically reducing troubleshooting time.
Essential Features to Look for in Observability Tools
Choosing an observability platform involves much more than comparing dashboards. Organizations should evaluate how well a solution performs under real production workloads.
High-Performance Metrics Storage
Metrics form the foundation of observability. Every server, container, database, and application continuously generates telemetry data.
An effective platform should efficiently store billions of time series while maintaining fast query performance.
Scalable storage also allows organizations to retain historical metrics without rapidly increasing infrastructure costs.
Log Management
Logs provide detailed information about application behavior, errors, authentication attempts, and system events.
A good observability platform should centralize logs, support fast searching, and make it easy to correlate logs with metrics and traces during incident investigations.
Distributed Tracing
Microservices have made request tracing essential.
Distributed tracing enables engineering teams to visualize how requests move across services, making it much easier to identify slow database queries, failed API calls, or network bottlenecks.
Without tracing, troubleshooting complex applications often becomes a time-consuming manual process.
Scalability
Your monitoring platform should grow alongside your infrastructure.
Whether monitoring hundreds of virtual machines or thousands of Kubernetes nodes, observability tools should maintain performance without introducing excessive operational complexity.
Horizontal scalability becomes particularly important for enterprise environments where telemetry volumes increase continuously.
Open Standards Compatibility
Modern observability platforms should integrate with widely adopted technologies such as:
- Prometheus
- Grafana
- OpenTelemetry
- Kubernetes
- Alertmanager
Support for open standards reduces vendor lock-in and simplifies migrations as infrastructure evolves.
Comparing Different Types of Observability Tools
Not every observability solution serves the same purpose.
Metrics-Focused Platforms
These platforms specialize in collecting and querying time series metrics.
They are ideal for:
- Infrastructure monitoring
- Performance dashboards
- Capacity planning
- Alerting
High-performance metrics storage becomes especially important as environments grow.
Log Management Platforms
These focus on collecting, indexing, and searching application logs.
They provide valuable diagnostic information but often require integration with metrics platforms to deliver complete observability.
Distributed Tracing Solutions
Tracing platforms visualize request flows across distributed applications.
They help engineering teams understand service dependencies and identify latency bottlenecks that metrics alone cannot reveal.
Unified Observability Platforms
Modern observability solutions combine metrics, logs, and traces within a single platform.
This unified approach eliminates data silos while significantly improving troubleshooting efficiency.
For most organizations, unified observability delivers better operational visibility than maintaining separate tools for each telemetry source.
Why Scalability Should Be Your Top Priority
Many organizations choose monitoring platforms based on current infrastructure size.
Unfortunately, cloud environments rarely remain static.
As applications grow, telemetry volumes increase dramatically. Kubernetes clusters create thousands of new metrics every day, while distributed microservices generate increasingly complex telemetry data.
Platforms that perform well in small environments may struggle with:
- Long-term metric retention
- High-cardinality workloads
- Slow dashboard queries
- Increasing infrastructure costs
- Complex scaling requirements
Choosing a platform built for scalability from the beginning prevents costly migrations later.
Why VictoriaMetrics Stands Out
When evaluating modern observability tools, scalability, storage efficiency, and operational simplicity should be top priorities.
VictoriaMetrics is designed specifically for organizations that need a high-performance observability platform capable of handling massive telemetry workloads without unnecessary complexity.
Unlike many traditional monitoring systems, VictoriaMetrics provides:
- High-performance time series storage
- Excellent compression for lower storage costs
- Horizontal scalability
- Fast query performance
- Prometheus compatibility
- OpenTelemetry support
- Kubernetes-native integration
- Enterprise-ready architecture
Organizations can continue using their existing Prometheus exporters, Grafana dashboards, and monitoring workflows while benefiting from a significantly more efficient storage engine.
This compatibility makes migration straightforward while allowing engineering teams to improve performance without rebuilding their monitoring infrastructure.
How to Choose the Right Observability Platform
Before selecting an observability solution, ask the following questions:
- Can it scale with future infrastructure growth?
- Does it support metrics, logs, and traces?
- Is it compatible with Prometheus and OpenTelemetry?
- Can it efficiently manage high-cardinality metrics?
- Will it reduce operational complexity instead of increasing it?
- Does it provide fast queries across large historical datasets?
- Can it lower long-term infrastructure and storage costs?
Answering these questions helps organizations choose a platform that supports both current and future monitoring requirements.
Final Thoughts
Selecting the right observability tools is about more than collecting telemetry—it is about building a monitoring platform that can grow with your business. As cloud-native architectures become more distributed, engineering teams need solutions that provide complete visibility without sacrificing performance or increasing operational complexity.
While many observability platforms offer basic monitoring capabilities, VictoriaMetrics delivers the scalability, storage efficiency, and performance required for modern production environments. Its seamless compatibility with Prometheus, Kubernetes, Grafana, and OpenTelemetry allows organizations to modernize their observability stack without disrupting existing workflows.
Whether you’re building a new monitoring platform or replacing an aging metrics database, choosing a scalable observability solution today will help ensure your infrastructure remains reliable, cost-efficient, and ready for future growth.