
Modern teams collect more information than ever. A product manager may bring customer feedback, a researcher may bring interview notes, an engineer may bring system constraints, and a marketer may bring campaign data. Each person has useful context, but the team still needs one shared view before it can make a confident decision.
That is where visual notes become useful. They turn scattered information into a structure that people can inspect together. Instead of reading through long documents and trying to remember every detail, a team can look at a diagram, map, or workflow and quickly see what matters.
Why written notes are often not enough
Written notes are excellent for detail. They capture quotes, definitions, ideas, risks, and decisions. But they are not always the best way to show relationships.
For example, a project brief might include:
- Customer problems
- Feature ideas
- Dependencies
- Technical risks
- Research findings
- Launch requirements
- Follow-up questions
When these points stay in paragraph form, readers must build the structure in their own heads. Different readers may imagine different priorities or miss important connections. One person may focus on the customer problem, while another focuses on the implementation risk.
A visual note brings those pieces onto the same page. It helps the team compare ideas, notice gaps, and discuss trade-offs without losing the bigger picture.
Start by choosing the question
The best visual notes begin with a clear question. Without a question, the diagram can become a collection of everything the team knows, which usually makes it harder to understand.
Useful questions include:
- What problem are we trying to solve?
- Which steps happen before a decision is made?
- Where do users get stuck?
- Which teams are responsible for each part?
- What information is missing?
- Which risks should be handled first?
Once the question is clear, the format becomes easier to choose. A workflow can explain sequence. A comparison chart can explain options. A mind map can organize ideas. A system diagram can explain dependencies. A timeline can explain order and urgency.
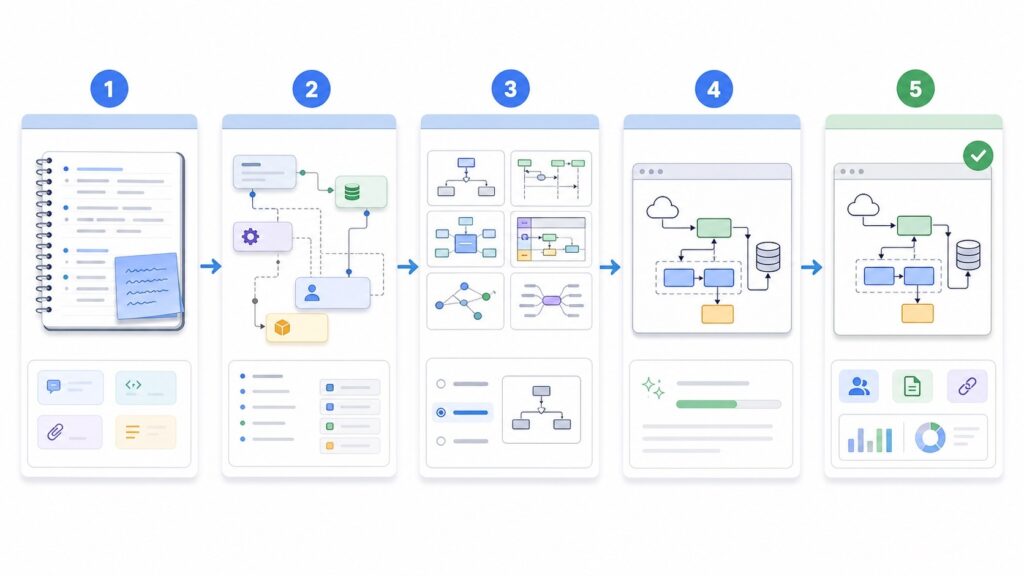
Use AI to make the first draft faster
Creating a useful diagram does not always require a designer. Teams can start with rough notes and use an AI diagram tool to create a first draft. This is especially helpful when the team needs to move from messy input to a clear discussion quickly.
The key is to give the tool structured input. Instead of pasting a long transcript, summarize the main points first:
- The audience for the diagram
- The question the visual should answer
- The main people, systems, or steps involved
- The relationships between those items
- The level of detail needed
For example, a team might write: “Create a workflow diagram for a product review meeting. Show how customer feedback becomes a feature request, how the request is prioritized, how engineering reviews the risk, and how the final decision is documented.”
That kind of prompt gives the tool a clear job and makes the output easier to review.
Review the diagram before using it
AI-generated visuals should be treated as drafts. They can save time, but they still need human review. A clean diagram can look convincing even when it leaves out a key step or shows a relationship incorrectly.
Before sharing the visual broadly, teams should check:
- Are the main ideas included?
- Are the arrows and labels accurate?
- Is anything invented or exaggerated?
- Is the diagram simple enough for the audience?
- Does it answer the original question?
- Should the topic be split into two smaller diagrams?
This review step is where the team adds judgment. The tool helps with structure, but the team decides what is true, useful, and ready to share.
Where visual notes help most
Visual notes are useful in many everyday workflows. In research, they help organize interview findings and recurring themes. In product planning, they help compare feature ideas and user journeys. In technical projects, they help explain systems, dependencies, and handoffs. In meetings, they help turn discussion into a record that people can return to later.
They are also helpful for onboarding. A new teammate can read a long document, but a clear visual map often makes the first hour of learning much easier. It gives them a starting point before they dive into the details.
Final thought
Teams do not need visuals because written notes are bad. They need visuals because decisions depend on relationships, not just facts.
When teams turn research, project notes, and scattered ideas into diagrams, they make the work easier to discuss. AI can speed up the first draft, but the real value comes from the review process: deciding what matters, correcting what is unclear, and giving everyone the same shared view.