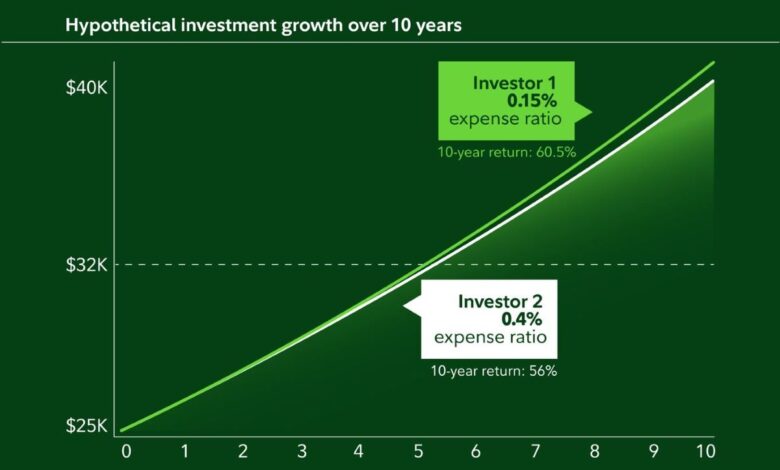
The Fee Is Small Only When You Look at One Year
Investors often compare funds by recent performance, brand recognition, or the reputation of the manager. The expense ratio is easier to ignore because it is shown as a percentage rather than a dollar bill. A charge of 0.50%, for example, equals $5 per year for every $1,000 invested. That does not sound alarming on its own.
The problem is the time horizon. Fund operating expenses are deducted from fund assets, so they lower the return that reaches shareholders. The missing money cannot remain invested, and it cannot compound in later years. A small annual gap therefore becomes a growing gap in portfolio value.
What an Expense Ratio Actually Covers
An expense ratio is the percentage of a mutual fund or exchange-traded fund’s average net assets used each year to pay operating costs. Those costs may include investment management, administration, custody, accounting, legal services, and distribution expenses. The number appears in the fund prospectus and shareholder reports as total annual fund operating expenses.
Investors do not normally receive a separate invoice. The charge is embedded in the fund’s results. That makes expense ratios less visible than a brokerage commission, even though they continue for as long as the fund is held.
How Fee Drag Compounds
Assume two funds own similar assets and earn the same 8% annual return before expenses. Fund A charges 0.20%, leaving an assumed net return of 7.80%. Fund B charges 1.20%, leaving 6.80%. The annual difference is one percentage point, but the ending gap is not limited to 1% of the original investment.
| 30-Year Comparison | Fund A | Fund B |
|---|---|---|
| Starting investment | $50,000 | $50,000 |
| Gross annual return assumption | 8.00% | 8.00% |
| Expense ratio | 0.20% | 1.20% |
| Assumed net annual return | 7.80% | 6.80% |
| Value after 30 years | $475,919 | $359,838 |
Result: Fund A finishes about $116,080 ahead. Fund B ends with roughly 24% less wealth than Fund A, even though the fee difference was only one percentage point. This is a simplified illustration, not a forecast; it assumes annual compounding, no additional contributions, and no taxes or trading costs.
A deeper expense ratio impact on long-term returns analysis can help investors convert the percentage shown in a prospectus into a long-term dollar estimate for their own balance, contribution rate, and time horizon.
The U.S. Department of Labor illustrates the same mechanism in retirement accounts. Its example compares a $25,000 balance invested for 35 years at a 7% average return. When fees reduce returns by 0.5%, the account grows to about $227,000. When fees reduce returns by 1.5%, it grows to about $163,000. The one-percentage-point difference cuts the ending balance by 28%.
Compare Like With Like
Expense ratio comparisons are useful only when the funds serve a similar purpose. A broad US stock index fund should be compared with another broad US stock fund, not with a bond fund, sector fund, or international strategy. Different asset classes carry different risks and expected returns, so the cheapest product is not automatically the best match.
A fair comparison should consider the following points:
- Investment objective and benchmark: Do both funds provide similar market exposure?
- Risk and diversification: Does one fund take concentrated or specialised risks that the other does not?
- Net performance: Has the fund delivered value after expenses, not merely before them?
- Tracking difference: For an index fund, how closely has it followed its benchmark after costs?
- Tax and trading effects: Could turnover, bid-ask spreads, commissions, or capital-gains distributions create additional costs?
When a Higher Expense Ratio May Be Reasonable
A higher fee is not automatically wasteful. Some funds provide exposure that is difficult to obtain cheaply, use a genuinely differentiated strategy, or offer services that an investor values. The correct question is whether the expected benefit is large and durable enough to overcome the higher cost after expenses.
That hurdle is demanding. A high-cost fund must outperform a comparable low-cost alternative by enough to cover its fee disadvantage, and it must do so over the investor’s actual holding period. Past outperformance alone does not prove that the advantage will continue.
Costs the Expense Ratio Does Not Show
The expense ratio is important, but it is not the complete cost of ownership. Depending on the product and account, investors may also face sales loads, advisory charges, account fees, commissions, bid-ask spreads, taxes, and trading costs within the portfolio. Some “zero-expense” or very low-cost funds can still create other expenses.
This is why investors should not stop at the headline percentage. The goal is to compare the total cost of obtaining the same investment exposure.
Where to Find the Number
The most reliable place to check an expense ratio is the fund’s current prospectus or official fund page. Brokerage platforms also display it, but investors should confirm whether the figure is gross or net. The net expense ratio reflects any current contractual fee waivers; the gross figure shows the cost before those waivers.
A practical review can be completed in a few minutes:
- List each mutual fund or ETF in the account.
- Record the current net expense ratio from an official source.
- Identify comparable funds with similar objectives and risk exposure.
- Estimate the long-term dollar gap using realistic assumptions.
- Check taxes, trading restrictions, and employer-plan limitations before making a change.
The Decision You Can Control
Investors cannot control future market returns. They can control much of what they pay to access those returns. That makes the expense ratio one of the few portfolio variables that can be reviewed before the outcome is known.
The right response is not to choose the cheapest fund without thinking. It is to demand a clear reason for every additional fee. When two funds provide comparable exposure, the lower-cost option begins with a measurable advantage, and that advantage compounds for as long as the investment remains in place.
Sources and Methodology
• U.S. Securities and Exchange Commission, Investor.gov: How Fees and Expenses Affect Your Investment Portfolio (updated July 23, 2025).
• U.S. Department of Labor: A Look at 401(k) Plan Fees.
• Calculation method: The 30-year comparison assumes a $50,000 initial investment, 8.00% gross annual return, annual compounding, and expense ratios of 0.20% and 1.20%. Values were independently recalculated as $50,000 × (1 + net return)^30 and rounded to the nearest dollar.
Educational information only. This article does not provide personalised investment, tax, or legal advice.